Content marketing takes lots of effort and time in planning, production and designing it to be relevant and interesting to your audience.
Producing content is an excellent way to bring new users to your website and capture potential leads.
But, do you measure how your content is helping to drive sales and leads and grow your bottom line?
“Half the money I spend on advertising is wasted; the trouble is I don’t know which half.” – John Wanamaker
One of the most powerful statements in the marketing world, but is it relevant today? Not with content marketing.
What is content marketing? It is the distribution of online materials, not necessarily promoting the brand but stimulating interest in its products and/or services.
Digital Giants is going to teach you how to measure your contents’ performance and help you find out how effective it has been at achieving your objectives.
Measuring Your Content in Google Analytics
In order to understand if your content is effective you will need to understand how your audience visits and navigates your site. Below are some basic metrics you can use to better understand your audience’s on-site journey.

Pageviews
This is the total number of views your website pages have received. You can isolate individual sections or pages of your website to find out how many views they have had over a period of time.
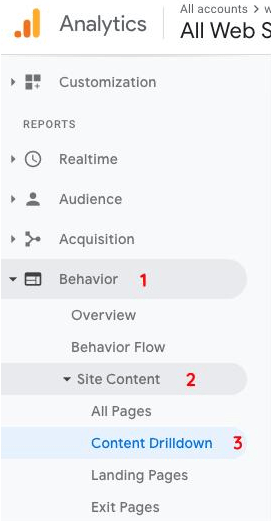
To isolate specific sections of your website in Google Analytics, use the menu on the left-hand side and select: Behaviour → Site Content → Content Drilldown.

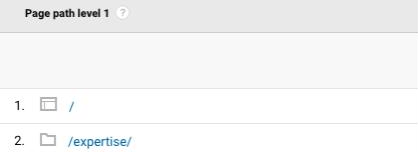
Now your primary dimension will be the page path level 1, these are the different sections of your website. Selecting one of these will bring you to the next level and show you the content that is in this section.

As you can see in the image above I can isolate any page in the “expertise” section of our website. These are our service pages. Assessing this section helps us understand how potential clients are visiting our services and if they are following the intended journey we have built.
You can also use unique page views to remove any instances of returning users. This is helpful when determining if your content is generating traffic for your site. Assessing your content over a period of time, you can see if users are coming to the page.
New Users
This will show you how many new visitors are coming to your website for the period selected and provide you with insight into how your content is generating new website traffic.
Time on Page
This will help you understand how long users are staying on the page and if they are consuming your content.
If users are not spending much time on the page, your content may not be capturing the users’ interest causing them to leave. Your content may also be short. You may need to re-work your content to better serve the users visiting this page.
Conversions / Goals
To help you understand how your content is contributing to your website journey and marketing objectives you can use Goals in Google Analytics to track actions taken by users with your content. Defining Goals in Google Analytics helps you measure how well your site fulfils target objectives on your site.
Some common Google Analytics goals are:
- Destination
- This can track when users reach an important page in the conversion funnel. For example, you could count every visit to a “Thank You” page which the user views only after completing a goal such as a download or registration.
- Duration
- Duration goals can help you understand how engaged users are on your website. Setting up multiple duration goals can help you understand how long someone is on your site before they convert.
- Events
- Events can be the most valuable goals you set up in Google Analytics. But, they are also the most complicated.
Events track user actions on your site, things such as video plays and button clicks. This provides you with insight into what users are engaging with and if they are completing the intended actions. These can be complicated to set up as it requires some code work or using Google Tag Manager. - Pages Per Session
- This measures how many pages users are viewing when they visit your website. Depending on your website “engaged” could be 2 or 3 pages. When setting up this goal you select a minimum number of pages before this fires.
User Retention Metrics
Bounce Rate
This measures the percentage of users who visit a page on your website and leave without viewing another page. If you find your content has a high bounce rate, it may not be capturing users who are visiting the page.
Ensure users are finding what they are coming for when they land on the page. If your content does not address the user’s search within the first few lines it may cause them to leave or bounce off your site.
One way to remedy a high bounce rate is to use internal links or calls to action (CTAs). This helps to guide your audience deeper into the website. Internal links make it easy for users to continue their on-site journey, allowing them to discover more content.
Something To Consider
If you are running advertising and sending users to a certain page, this page will most likely have a higher bounce rate than other pages on your website. This is because you are sending users to the page who have little intent compared to those who came organically. With less intent, they are more likely to leave.
Percent of Returning Users
The opposite of unique visitors, returning users shows you how many users are coming back to your website.
BONUS METRIC
One of our favourite analytics tools to use when publishing and distributing content are Urchin Tracking Module parameters (UTMs). UTM add variants to the URL which allow campaigns to be tracked in Google Analytics. This sounds way more complicated than it is.
UTMs allow you to use up to five parameters in your URL. These parameters provide Google Analytics with additional information that can help you isolate things like channels, campaigns, or keywords.
The five UTM parameters you can set are:
- Utm_source
- This identifies where the traffic is coming from
- Utm_medium
- This identifies the category of the source (organic search, CPC)
- Utm_campaign
- This identifies the promotion or campaign.
- Utm_term
- This identifies the search terms.
- Utm_content
- This identifies what the user clicked. (banner ad, text link)
To help you build your UTMs we recommend using the Campaign URL Builder. This tool allows you to simply fill in the blanks and provides you with the complete URL for you to use in your campaign.
All of these metrics and tools are offered to you free of charge, as long as you spend some time configuring your Google Analytics account you can track and measure content marketing efforts
If you have any questions about your content performance, reach out to us at Digital Giants. We are always happy to help.


